
A perceptual map is a simple chart that shows how customers see competing brands on two dimensions that matter to them, such as price and quality. By plotting your brand alongside its competitors, you can see where the market is crowded, where there is space and whether customers see you the way you want to be seen.
Perceptual maps, sometimes called positioning maps, are one of the most practical tools in brand positioning. This guide explains what they show, walks through a worked example, explains how to choose the right axes and gives a step-by-step method for making your own.
What is a perceptual map?
A perceptual map places brands, products or services on a grid made of two axes. Each axis represents an attribute customers use to compare options, with opposite ends such as low price and high price, or traditional and modern. Each competitor appears as a point on the grid, based on how customers perceive it.
The key word is perceptual. The map shows what customers believe, not what a company claims about itself. Two brands with similar prices can sit far apart if customers see one as premium and the other as ordinary.
Why use a perceptual map?
- Spot gaps in the market. Empty areas of the map can point to positions no competitor owns.
- See where competition is fiercest. Clusters of brands show crowded positions where it is hard to stand out.
- Check your current position. Comparing where customers place you with where you want to be reveals the size of the gap.
- Align the team. A single visual makes positioning discussions concrete and easier to agree on.
- Plan a repositioning. The map shows which direction you need to move and which competitors you would meet there.
Perceptual map example
Imagine an independent coffee shop opening in a busy market town. The owner maps the local options on two axes that matter to customers: price, from budget to premium, and experience, from grab-and-go to stay-and-linger. The competitors below are fictional, but the logic applies to any market.
| Competitor | Price | Experience |
|---|---|---|
| National coffee chain | Mid-range | Grab-and-go, with some seating |
| Petrol station coffee machine | Budget | Grab-and-go |
| Supermarket café | Budget | Basic seating, short stays |
| Specialist roastery | Premium | Short stays, focused on the coffee |
| Hotel lounge | Premium | Stay-and-linger |
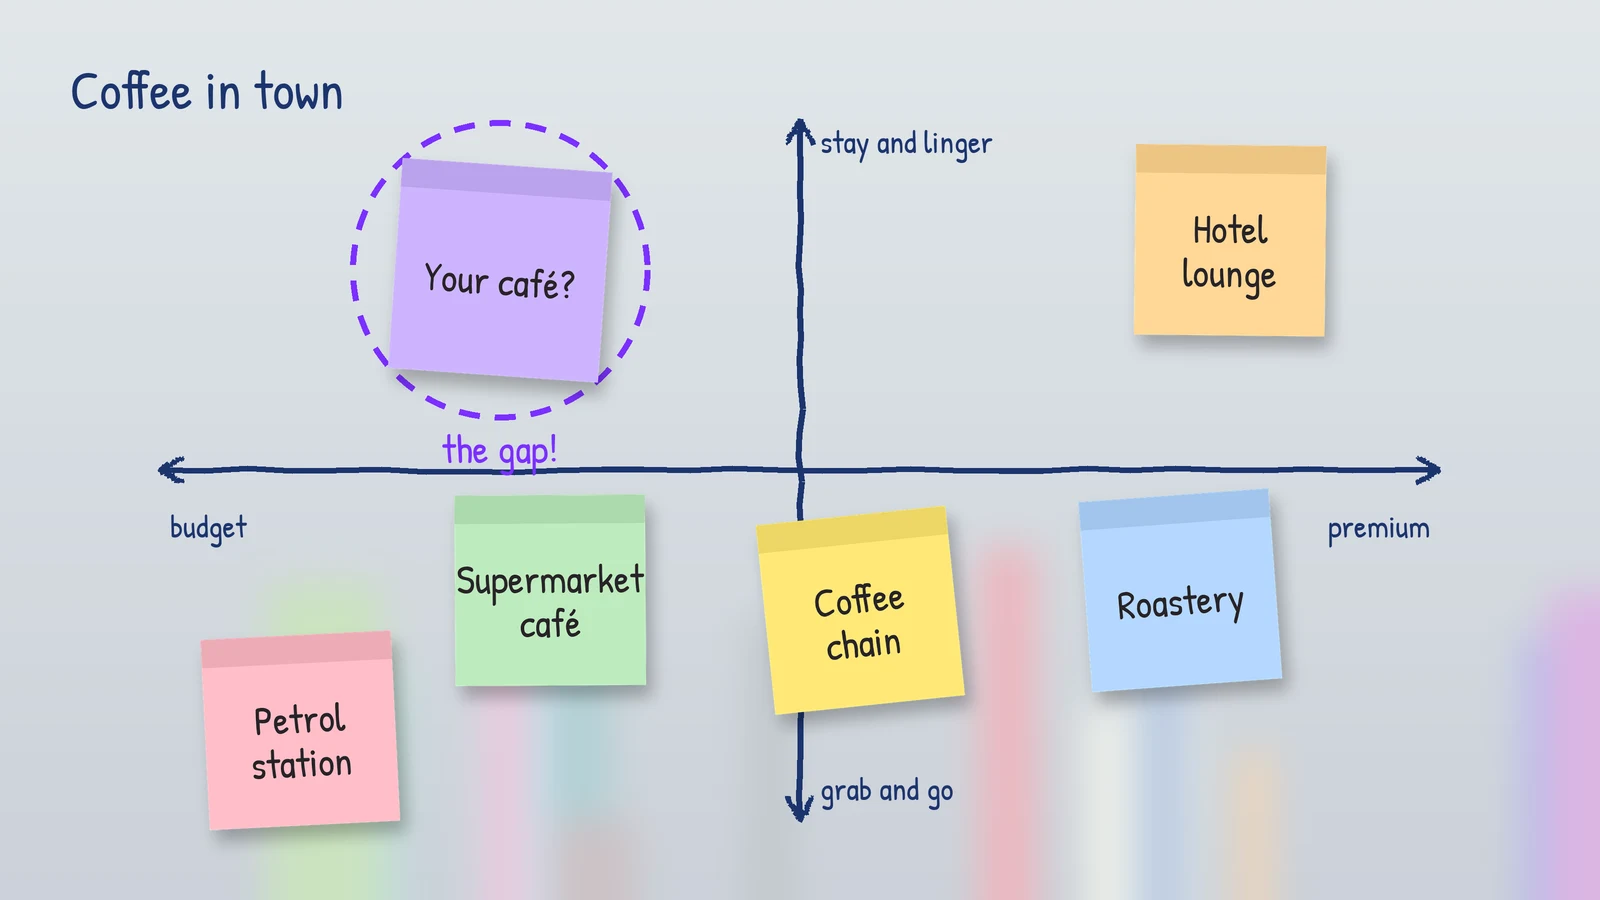
Plotted on the map, a clear pattern appears. Budget options are all grab-and-go, and the only place to settle in for a long stay is the expensive hotel lounge. The space for an affordable café where people are welcome to stay, work or meet friends is empty. That gap becomes the new shop’s position, and it shapes everything from the furniture and Wi-Fi to the menu and pricing.
Before acting on a gap, the owner still needs to check that customers actually want it. An empty space is only an opportunity if there is demand.
Grounding an axis in real data
Some axes can be measured rather than guessed. Price is the easiest. In the UK supermarket market, Which? compares the price of the same basket of groceries every month. In its August 2026 analysis of 92 items, Aldi was cheapest at £159.36 and Waitrose most expensive at £223.75. Data like this gives a perceptual map a solid anchor at each end of the price axis.
The second axis is usually harder. Attributes such as quality, convenience or trust live in customers’ heads, so they need research: surveys, interviews, reviews and the language customers use when they talk about brands. Reviews in particular are a rich source, because they show what customers notice, praise and complain about, which is also why they work as social proof.
How to choose the right axes
The axes decide what the map can tell you. Good axes share three qualities:
- They matter to buyers. Choose attributes customers genuinely use to decide, not features the business happens to be proud of.
- They are independent. Avoid pairs that move together, such as price and perceived quality in many markets. If one predicts the other, the brands will line up on a diagonal and the map will show little.
- They separate competitors. If every brand scores the same on an attribute, it cannot reveal a position.
| Market | Useful axis pairs |
|---|---|
| Restaurants and cafés | Price vs experience; casual vs special occasion |
| Fashion | Price vs style; classic vs trend-led |
| B2B software | Simple vs powerful; self-serve vs supported |
| Professional services | Specialist vs generalist; local vs international |
| Consumer goods | Everyday vs indulgent; conventional vs sustainable |
It often helps to draw several maps with different pairs of axes. Each one reveals a different side of the market.
How to make a perceptual map in 6 steps
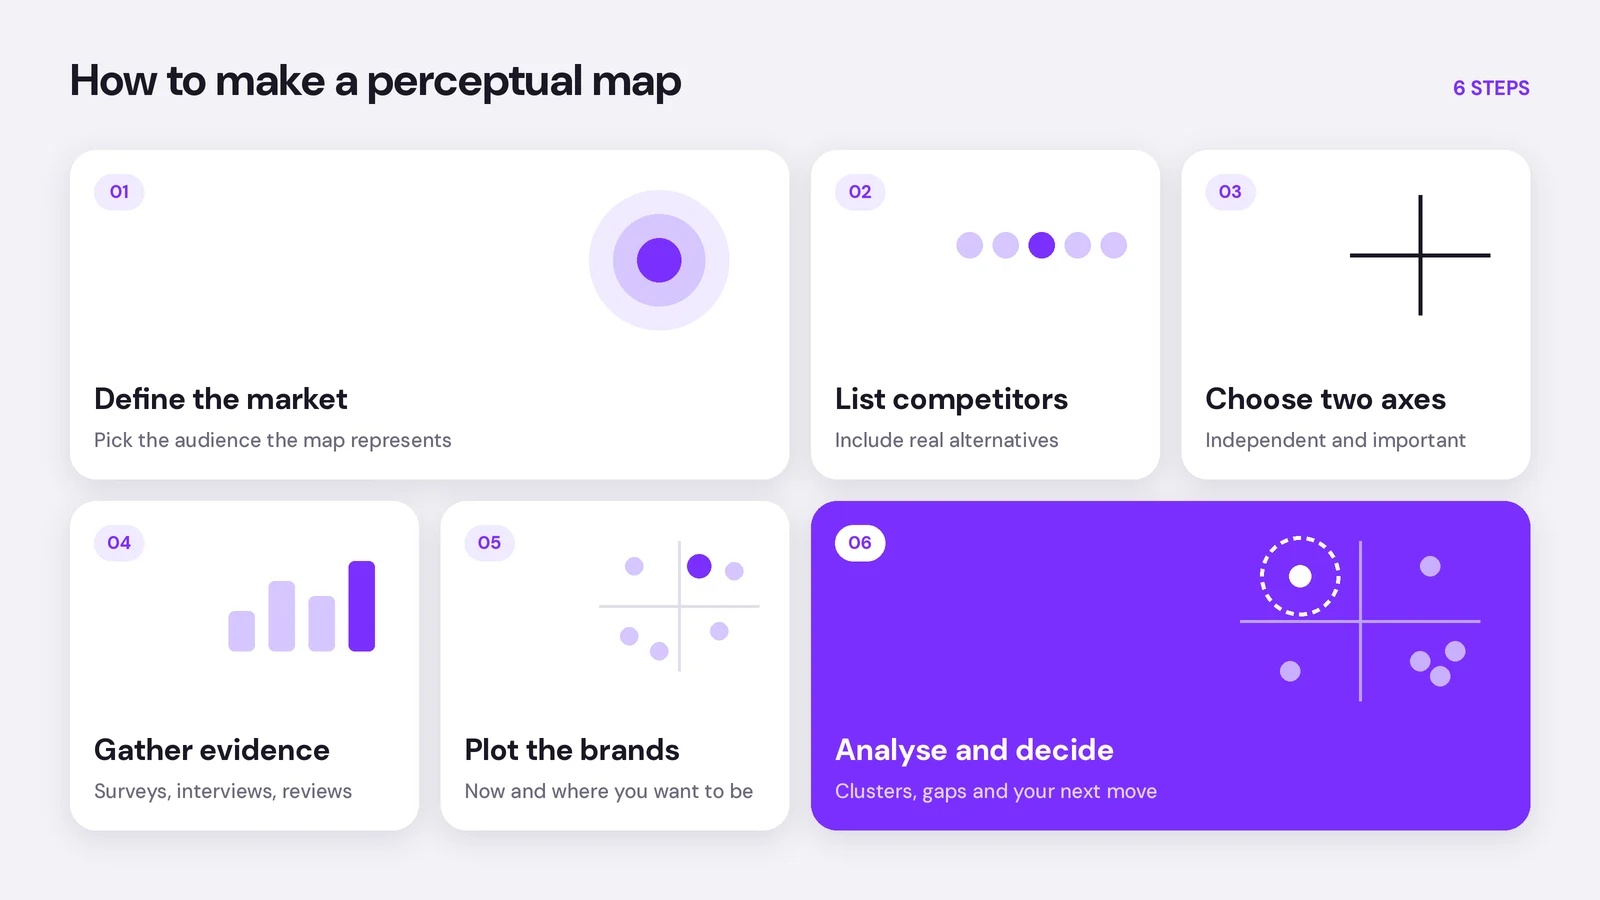
- Define the market and audience. Decide which customers the map represents. Different segments can see the same brands very differently, so be specific.
- List the competitors. Include direct rivals and the alternatives customers really consider, including different types of solution.
- Choose two axes. Pick attributes that matter to buyers, are independent of each other and separate the competitors.
- Gather evidence. Use surveys, customer interviews, reviews, sales conversations and public data. Score each competitor on both axes, for example on a scale of 1 to 10.
- Plot the brands. Draw the axes, place each competitor and add your own brand, both where customers see it now and where you want it to be.
- Analyse and decide. Look for clusters, gaps and the distance between your current and target positions, then decide what would need to change.
How to read a perceptual map
- Clusters show crowded positions. Entering one means competing head-on, usually on price or promotion.
- Empty spaces may be opportunities, or they may be empty because nobody wants that combination. Test demand before committing.
- Distance between brands shows how different customers think they are. Brands close together are seen as substitutes.
- The gap between where you are and where you want to be shows how much your product, pricing and communication need to change.
Limitations of perceptual maps
A perceptual map simplifies a complex market into two dimensions, so it can never show the whole picture. It is also a snapshot: perceptions change as competitors move and markets evolve. The biggest risk is building a map from internal assumptions rather than customer evidence, which can make it look precise while being wrong. Treat each map as a starting point for discussion and research, and update it regularly.
From perceptual map to positioning statement
Once you have chosen the position you want to own, the next step is to put it into words. A positioning statement turns the space on your map into a short description of who you serve, the category you compete in and why you are different, which keeps every later decision consistent with the position you chose.
Frequently asked questions
What is a perceptual map?
A perceptual map is a chart that shows how customers perceive competing brands on two attributes, such as price and quality. It helps businesses see crowded positions, gaps in the market and where their own brand stands.
Is a perceptual map the same as a positioning map?
The terms are often used interchangeably. Strictly, a perceptual map is based on customer perceptions, while a positioning map can also be based on objective data such as prices or features.
How do you choose axes for a perceptual map?
Choose two attributes that customers use to make decisions, that are independent of each other and that clearly separate the competitors. Drawing several maps with different axes often reveals more.
What data do you need for a perceptual map?
Customer evidence works best: surveys, interviews, reviews and sales conversations. Public data such as price comparisons can anchor objective axes like price.
What should you do with a gap on a perceptual map?
First check that customers actually want what the gap represents. If there is real demand, define the position in a positioning statement and align your product, pricing and messaging with it.
Find the space your brand can own
Kutola helps brands map their market, find a position worth owning and express it clearly across their website, content and campaigns. Get in touch to see where your brand stands.