How to run an A/B test you can trust
A/B testing compares two versions of a page, email or ad by showing each to a random half of your audience and measuring which one gets more of the result you care about. A test you can trust starts with a clear hypothesis and one main metric, uses a sample size you fix in advance, runs for whole weeks and is only judged once it has finished. Without enough traffic, a test produces noise that looks like an answer.
A/B testing is one method within conversion rate optimisation, and often the most misused one. This guide explains how A/B testing works, what to test, how to work out the sample size and length of a test, how to read the results honestly and what to do when you do not have enough traffic.
What is A/B testing?
In an A/B test, version A is usually what you have now, called the control, and version B is the change, called the variant. Visitors are assigned to one version at random and stay in it. Because both groups visit at the same time, outside factors such as the weather, a sale or a news story affect both equally, so any clear difference in results comes from the change.
That makes A/B testing the most reliable way to learn whether a change causes an improvement, rather than just happening at the same time as one. It is why large online businesses test so much. In the Harvard Business Review article The Surprising Power of Online Experiments, Ron Kohavi and Stefan Thomke reported that at Microsoft only about a third of tested ideas improved the metrics they were designed to improve. The rest made no difference or made things worse, and most of those losers would have shipped without a test.
Variations on the idea include A/B/n tests, which compare several variants at once, and multivariate tests, which change several elements together to find the best combination. Both need far more traffic than a simple A/B test.
What to test
The best tests come from evidence, not opinions. Session recordings, heatmaps, form analytics, customer surveys and sales calls show where people struggle, and each problem suggests a change worth testing.
- Offers and pricing presentation: a free trial against a demo, a bundle against single items, monthly against annual pricing shown first.
- Headlines and value propositions: what you lead with, and in whose words.
- Forms: fewer fields, a different order or splitting a long form into steps.
- Calls to action: what the button says and where it sits.
- Proof: reviews, guarantees and case studies placed near the decision.
- Page structure: a short page against a long one, or a different order of sections.
Bold changes are more useful than small tweaks for most businesses. A new offer or a much shorter form can move results enough to detect, while a change of button colour rarely does. Our guide to what makes a landing page convert lists the elements that usually matter most.
How to run an A/B test in 7 steps
- Write a hypothesis. Use a simple pattern: “Because we saw [evidence], we believe [change] will cause [effect] for [audience]. We will know when [metric] moves.” A hypothesis stops you testing at random and tells you what you learned, whatever the result.
- Choose one primary metric. Pick the result the change is meant to improve, such as completed enquiries or orders. Add guardrail metrics, such as refund rate or lead quality, to catch a win that causes harm elsewhere.
- Work out the sample size. Decide the smallest improvement worth detecting and calculate how many visitors each version needs, as explained below.
- Set the duration. Divide the sample size by your daily traffic and round up to whole weeks, so every day of the week is included at least once.
- Build and check the variant. Test both versions on mobile and desktop and in the main browsers, and check that tracking records conversions for both.
- Run the test without peeking. Leave it alone until it reaches the planned sample size. Do not change the pages, the traffic split or the goal while it runs.
- Analyse, decide and record. Check the result against your plan, decide whether to ship the change and write down what you learned.
How many visitors you need
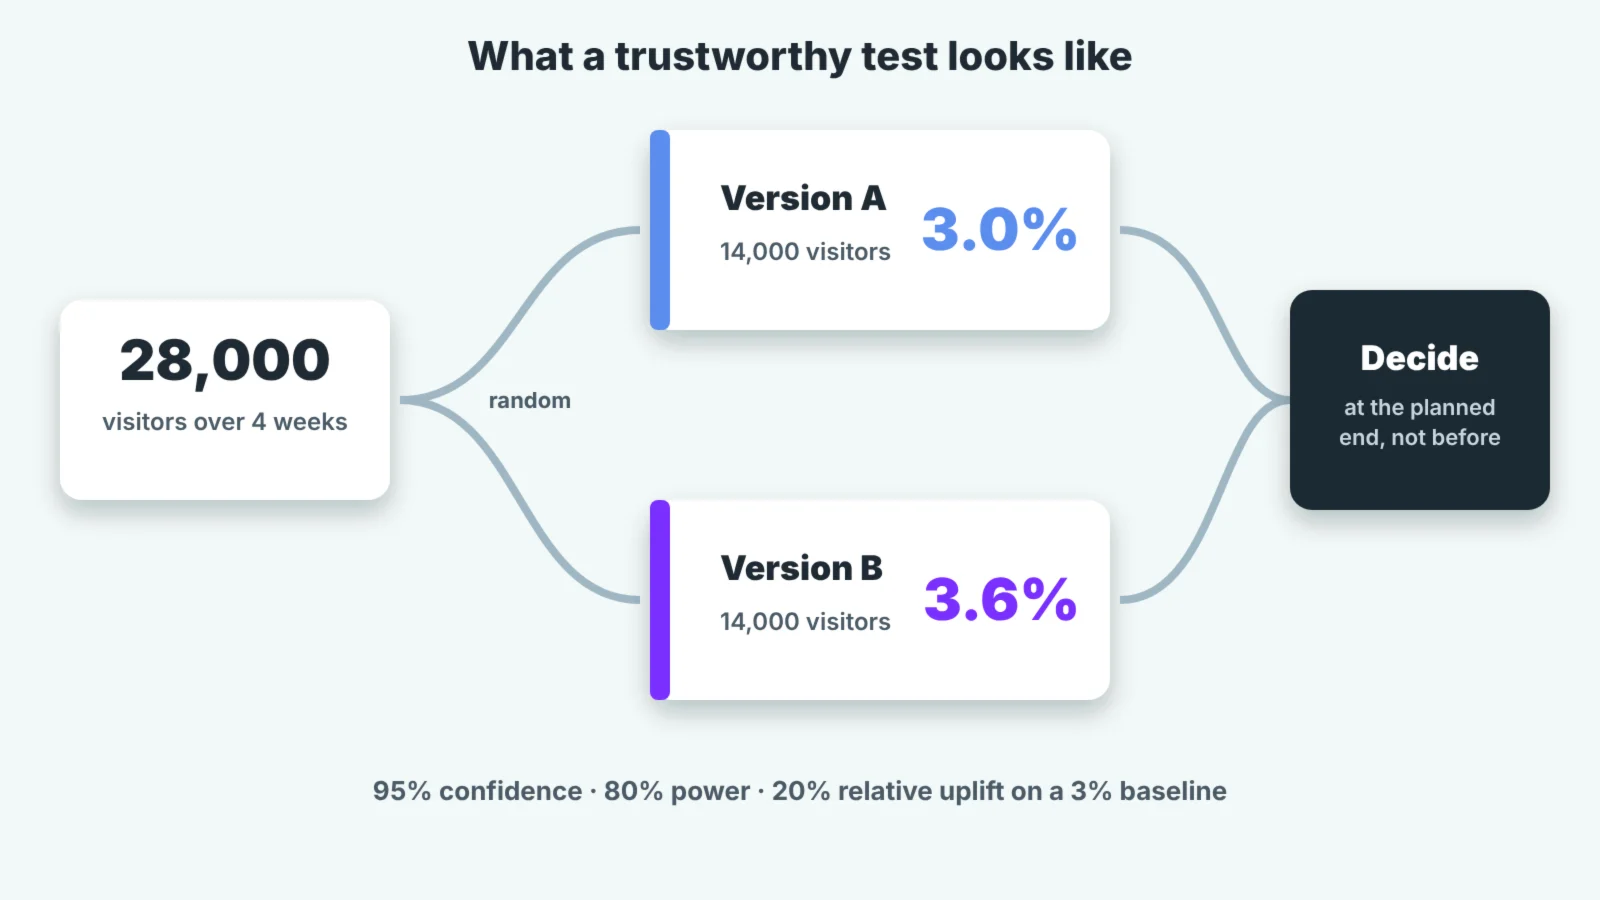
The traffic a test needs depends on three things. The first is your current conversion rate. The second is the smallest improvement you want to be able to detect, called the minimum detectable effect. The third is how sure you want to be. The common standard is 95% confidence, which limits the chance of a false win to 5%, and 80% power, which gives an 80% chance of detecting a real effect of the size you chose.
A worked example shows the scale. Suppose a page converts at 3% and you want to detect a 20% relative improvement, from 3% to 3.6%. At 95% confidence and 80% power, each version needs roughly 14,000 visitors, or 28,000 in total. With 1,000 visitors a day, the test needs four weeks.
Three rules follow from the maths:
- Smaller effects need far more traffic. Halving the effect you want to detect roughly quadruples the sample size.
- Low conversion rates need more traffic. A page converting at 1% needs about three times the visitors of one converting at 3% to detect the same relative change.
- Most small sites cannot test small changes. If the numbers come out at months, test a bolder change, use a more frequent conversion or choose another method.
Free sample size calculators, including those from testing tools such as Optimizely and VWO, do the arithmetic. What matters is doing it before the test starts.
How to read the results
A finished test produces an observed difference between the versions and a measure of how likely it is that a difference that large happened by chance. Most tools show this as statistical significance, a p-value or, in tools using Bayesian statistics, a “chance to beat control”.
- Judge at the planned end, not before. Checking results daily and stopping when they look good, known as peeking, makes false wins far more likely. Early results swing widely because the samples are small.
- Look at the range, not just the headline. A result of “+12%” with a confidence interval from -2% to +26% is not a reliable win. The interval shows the plausible size of the real effect.
- Check the split. If you planned a 50/50 split and one version got noticeably more visitors, something in the set-up is broken. This is called a sample ratio mismatch, and it makes the results untrustworthy.
- Be wary of segments. Slicing results by device, source and region after the test will always find some segment where the variant “won”. Treat those as ideas for new tests, not conclusions.
- Allow for novelty. Returning visitors sometimes click on anything new at first. If the effect fades over the weeks of the test, it may not last.
Kohavi, Tang and Xu’s book Trustworthy Online Controlled Experiments is the standard reference for these pitfalls and worth reading if testing becomes a regular part of your work.
What to do when you do not have enough traffic
Many small businesses do not have the visitors to test reliably, and that is fine. Testing is one way to make better decisions, not the only one.
- Fix obvious problems directly. A broken form on mobile or a confusing checkout step does not need a test. Fix it and monitor the numbers.
- Test on a more frequent action. Add to basket, form starts or clicks to a booking page happen more often than final sales, so a test needs less traffic.
- Make bigger changes. A completely different offer or page has a better chance of producing a detectable difference.
- Use qualitative research. Five user tests on a new design often reveal the biggest problems. Short surveys asking what stopped people buying help too.
- Compare before and after carefully. Run the change for several weeks, compare like-for-like periods and note anything else that changed, such as prices, campaigns or seasonality.
A/B testing tools
Google Optimize, once the default free option, closed in September 2023. Current options include dedicated platforms such as VWO, Optimizely, AB Tasty and Convert, and product analytics tools such as PostHog that include experiments. Many email platforms, ad platforms and some website builders have simple built-in A/B testing for subject lines, ads and page variants.
When choosing a tool, check how it affects page speed, whether visitors see a flash of the original page before the variant loads and whether it integrates with your analytics. Testing tools usually set cookies, so make sure your cookie banner and privacy notice cover them, as explained in our guide to PECR and cookies.
Common A/B testing mistakes
- Stopping when the result looks good. Peeking turns random swings into false wins.
- Testing without enough traffic. An underpowered test usually ends “inconclusive” or, worse, declares a winner by chance.
- Changing several things without meaning to. If version B has a new headline, image and button, a win tells you little about which change mattered. That is fine for a bold redesign test, as long as you know it.
- Ignoring guardrails. A variant that brings more leads of lower quality may lose money.
- Running for a few days. Weekday and weekend visitors behave differently. Run whole weeks.
- Not writing results down. A shared log of hypotheses, results and lessons stops the same idea being tested again and builds knowledge over time.
- Testing tricks that break the law. Fake urgency and hidden fees might win a test, but they break UK consumer law. Our guide to loss aversion and the rules explains where the line is.
Frequently asked questions
What is A/B testing?
A/B testing is a method of comparing two versions of a page, email or ad by showing each to a random group of people at the same time and measuring which one performs better against a chosen goal, such as sign-ups or sales.
How long should an A/B test run?
Long enough to reach the sample size you calculated before starting, and always in whole weeks so every day of the week is included. For many small and mid-sized sites that means two to six weeks.
How much traffic do you need for an A/B test?
It depends on your conversion rate and the size of change you want to detect. A page converting at 3% needs roughly 14,000 visitors per version to detect a 20% relative improvement at standard confidence levels.
What does statistical significance mean in A/B testing?
It indicates how unlikely it is that the difference between versions happened by chance. At 95% significance there is no more than a 5% chance of seeing a difference that large if the change had no real effect, provided the test ran to its planned sample size.
What is the difference between A/B testing and multivariate testing?
An A/B test compares two versions of a page. A multivariate test changes several elements at once to find the best combination, which needs much more traffic to produce reliable results.
On this page
Back to topTest changes that actually move the numbers
Kutola helps you find where your website loses people, decide what is worth testing and run experiments you can trust, or improve the pages directly when traffic is too low to test. See how it fits into our brand and digital experience work, or get in touch to talk through your website.