Conversion rate optimisation: how to turn more visitors into customers
Conversion rate optimisation (CRO) is the work of increasing the share of website visitors who take the action you want, such as buying, booking, calling or filling in a form. It finds where people drop out and why, fixes or tests the causes and keeps what measurably works, so the traffic you already have produces more customers.
This guide explains how to calculate your conversion rate and why small improvements matter so much, then covers the barriers that stop visitors converting. It walks through a seven-step CRO process, shows what to optimise first on each type of page and explains when to run an A/B test and what to do when you don’t have the traffic for one. It finishes with the behavioural science behind good CRO, the UK rules that limit some tactics, how to measure results and the mistakes that waste the most effort.
Key takeaways
- CRO is a research process, not a list of button colours. You find where visitors leave, learn why and change the cause.
- Raising your conversion rate makes every channel cheaper, because the same ad spend and the same rankings bring in more customers.
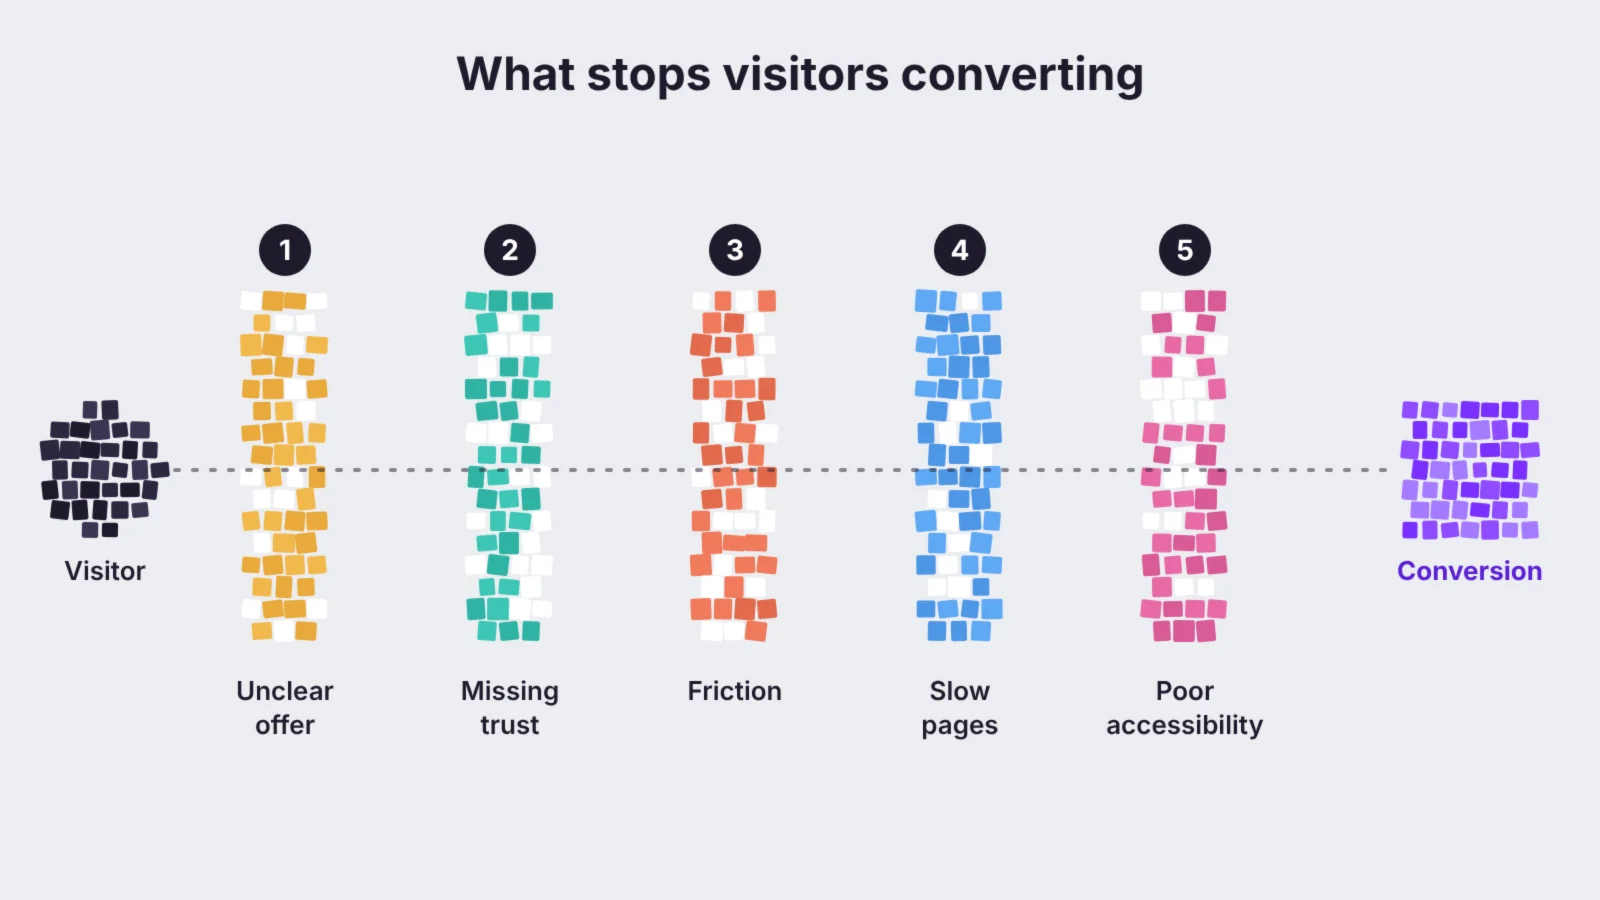
- Most lost conversions come from five barriers: an unclear offer, missing trust, friction, slow pages and sites that are hard for some people to use.
- A/B tests need enough traffic to give a reliable answer. Smaller sites can still improve by fixing clear problems and checking the results over time.
- In the UK, fake urgency and hidden fees are not just bad practice. Since April 2025 the CMA can fine businesses directly for them.
What is conversion rate optimisation?
A conversion is any action that moves a visitor closer to becoming a customer. For an online shop it is usually a purchase. For a service business it might be a quote request, a booked call or a phone click. Most sites also track smaller steps, such as adding to basket, starting a form or signing up for a newsletter, because they show where a larger journey breaks.
CRO improves the rate at which those actions happen. It draws on three kinds of evidence: numbers from your analytics that show where people leave, research that shows why they leave and experiments that show which change actually helps. The work covers the whole path to conversion, from the ad or search result someone clicked to the thank-you page, so it overlaps with copywriting, design, page speed and the offer itself.
Good CRO is not about tricking people into actions they would not choose. A page converts better when it answers the visitor’s questions, removes effort and gives them a reason to trust you. That makes CRO as much about understanding customers as about changing pages.
How to calculate your conversion rate
Your conversion rate is the number of conversions divided by the number of visits, multiplied by 100. A site with 8,000 sessions and 160 orders in a month has a conversion rate of 2%.
Three choices change the figure, so decide them before comparing anything:
- Sessions or users. Dividing by sessions gives a lower rate than dividing by users, because one person often visits several times before buying. Pick one and keep it.
- Which action counts. In Google Analytics 4 you choose which events are key events (what GA4 used to call conversions). Mixing newsletter sign-ups with purchases in one rate hides what is happening to each.
- Which traffic. A site-wide rate blends visitors who came to buy with people reading a blog post. Calculate it separately by channel, device and landing page, where the useful differences show up.
Published averages are a weak guide. Rates vary widely by sector, price, device and how a study defines a conversion, so the most useful benchmark is your own rate over time and the gap between your best and worst pages.
Why CRO matters
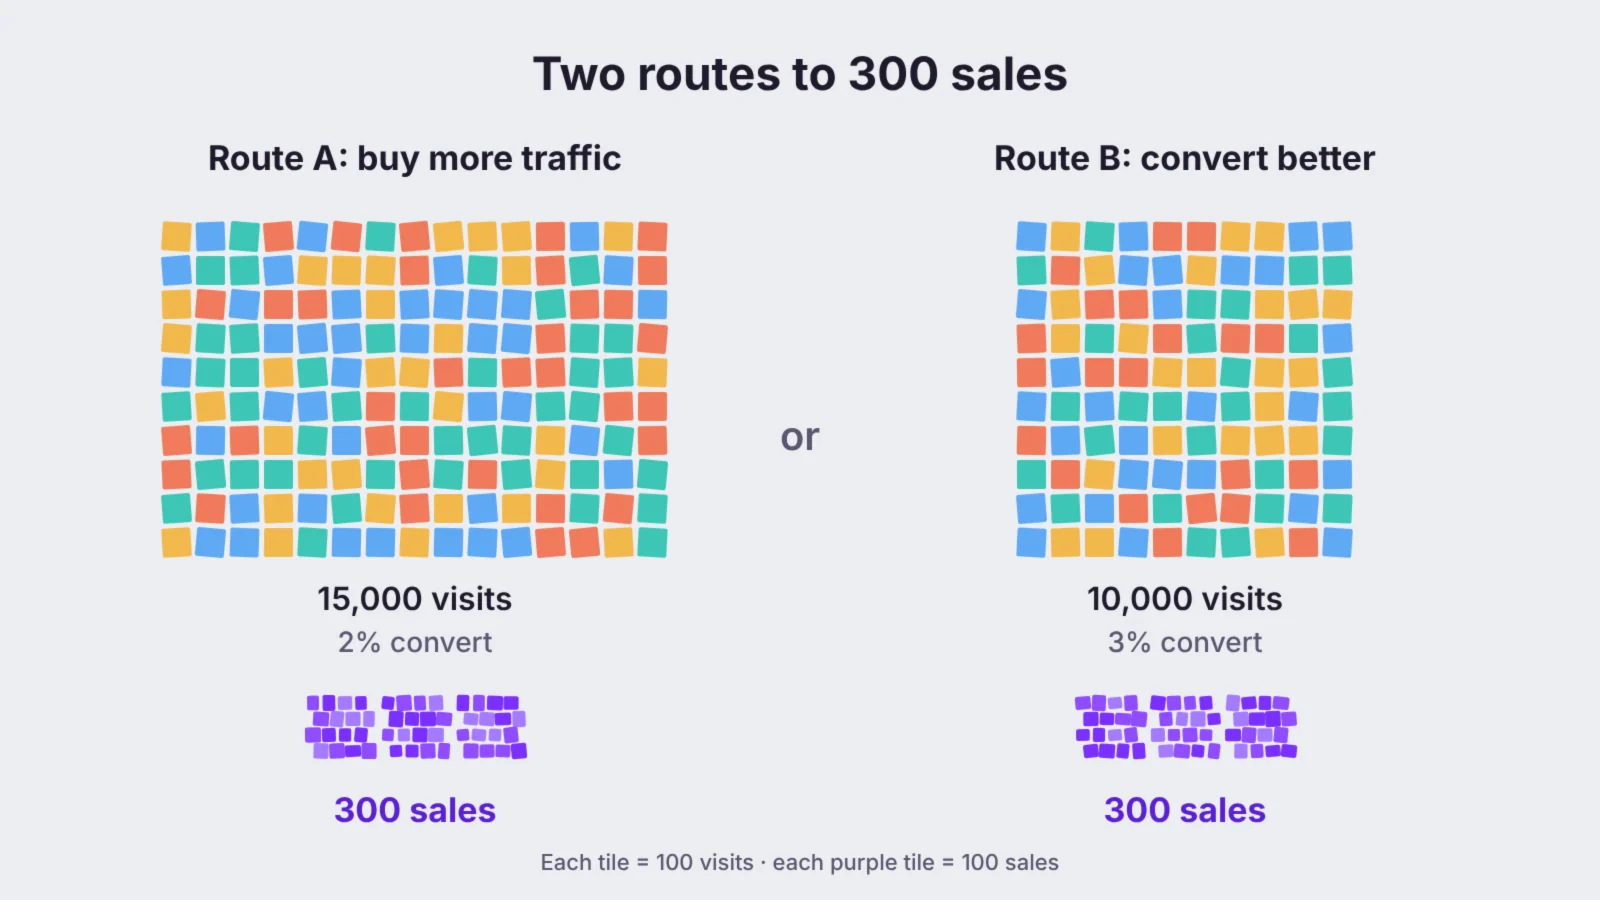
Conversion rate multiplies everything else you spend. Take a shop with 10,000 visits a month, a 2% conversion rate and an average order of £60. It makes 200 sales and £12,000 in revenue. To reach 300 sales it can buy 50% more traffic, or it can raise its conversion rate from 2% to 3% on the visitors it already has. The second route also lowers the cost of every future sale, because each click from Google Ads or a social campaign is now worth more.
CRO also protects you when traffic gets harder to win. AI answers in search, rising click costs and changing social algorithms all make visits more expensive. A site that converts well needs fewer of them, and it gives every channel in your digital marketing strategy a better return.
Finally, CRO research tells you things about customers that no other channel reports. Watching people struggle with a form, or reading why they nearly did not buy, often changes the offer, the messaging and even the product, not only the page.
What stops visitors converting
Most lost conversions trace back to five barriers. Checking a page against them is a quick way to find where to start.
- The offer is unclear or does not match the click. Visitors decide within seconds whether a page is for them. If the headline does not repeat what the ad or search result promised, or the page does not say what you sell, who it is for and why it is better, they leave. A sharp value proposition fixes more pages than any design change.
- There is not enough reason to trust you. New visitors look for reviews, clear prices, delivery and returns information, contact details and signs that real people stand behind the business. Placed near the decision, social proof answers the question “do people like me buy this?”.
- Too much friction. Every extra field, step, surprise cost and forced account adds a reason to stop. Baymard Institute puts the average documented online basket abandonment rate at 70.22%, and extra costs such as delivery, tax and fees are the most common reason shoppers give for leaving checkout.
- Slow pages. Speed shapes behaviour before anyone reads a word. A study commissioned by Google and run by Deloitte across 37 brand sites found that a 0.1 second improvement in mobile speed lifted retail conversions by 8.4% and average order value by 9.2%.
- The site is hard for some people to use. Small text, poor contrast, forms that do not work with a keyboard and confusing error messages shut out a large group of customers. The UK’s Click-Away Pound survey found that 69% of disabled online shoppers leave sites they find hard to use, taking an estimated £17.1bn of spending with them in 2019.
How to do CRO in 7 steps
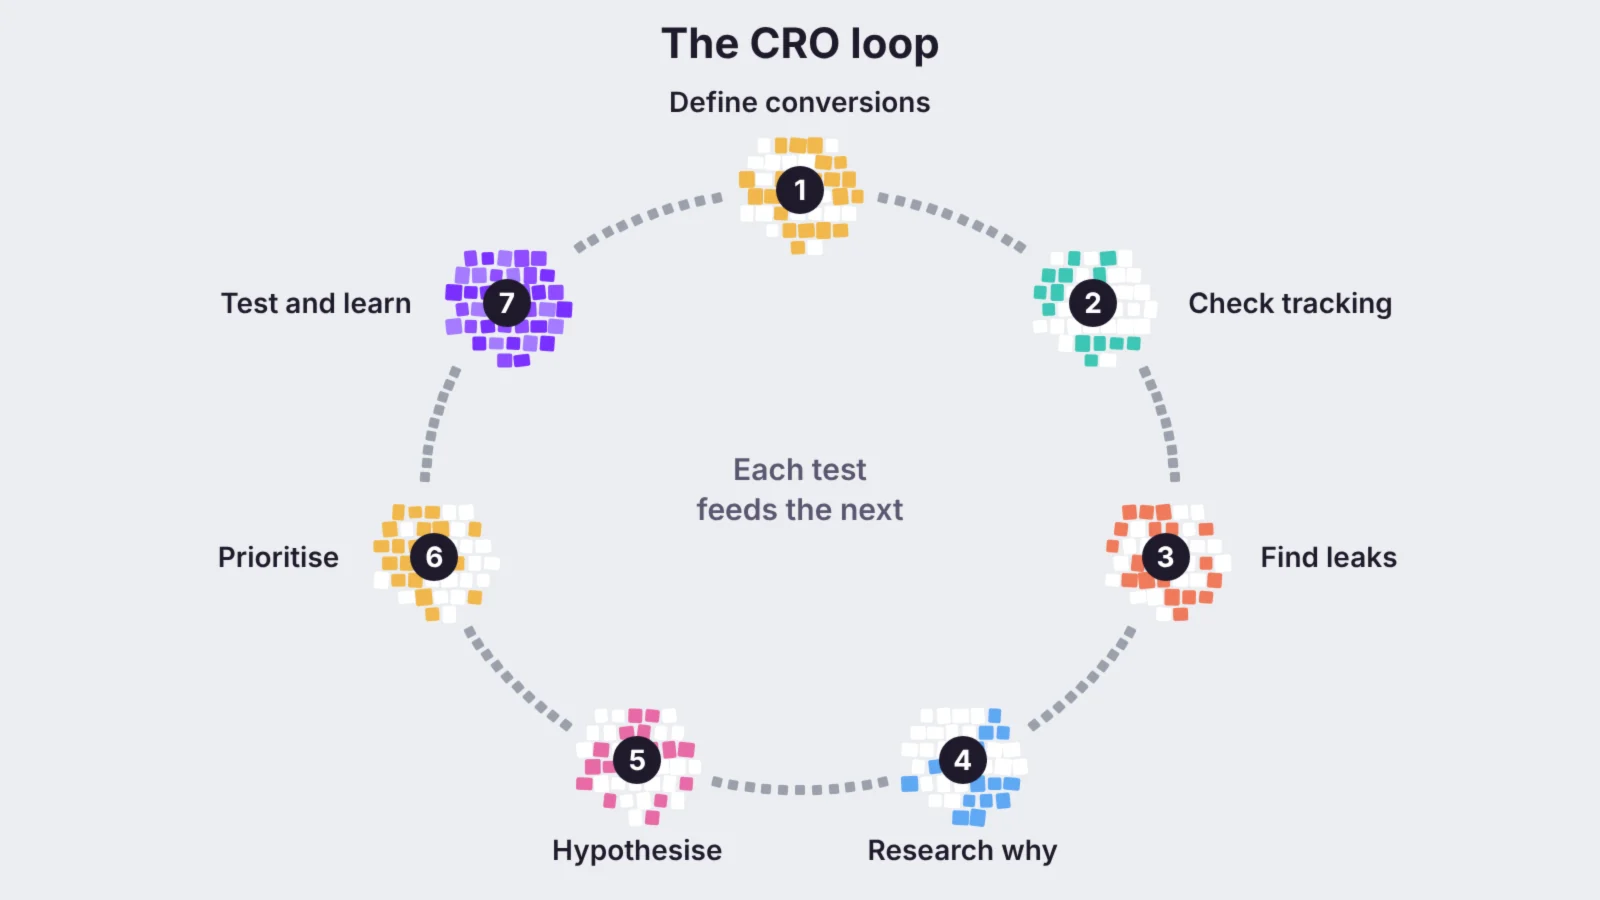
The process below works for a shop, a lead generation site or a booking page. The order matters: teams that jump straight to testing usually test the wrong things.
1. Define the conversions that matter
Choose one primary action per page type and a few micro-conversions that lead to it. Agree what each is worth: an order has a value, and a lead can be valued by your close rate and average deal size. Without values you cannot tell whether more sign-ups and fewer sales is a win. Tie these figures to the goals in your marketing KPIs.
2. Check your tracking
Place a test order, submit every form and click every phone number, then confirm each one appears once, and only once, in your analytics. Broken or double-counted events are common, and they make any later result meaningless.
3. Find where visitors leave
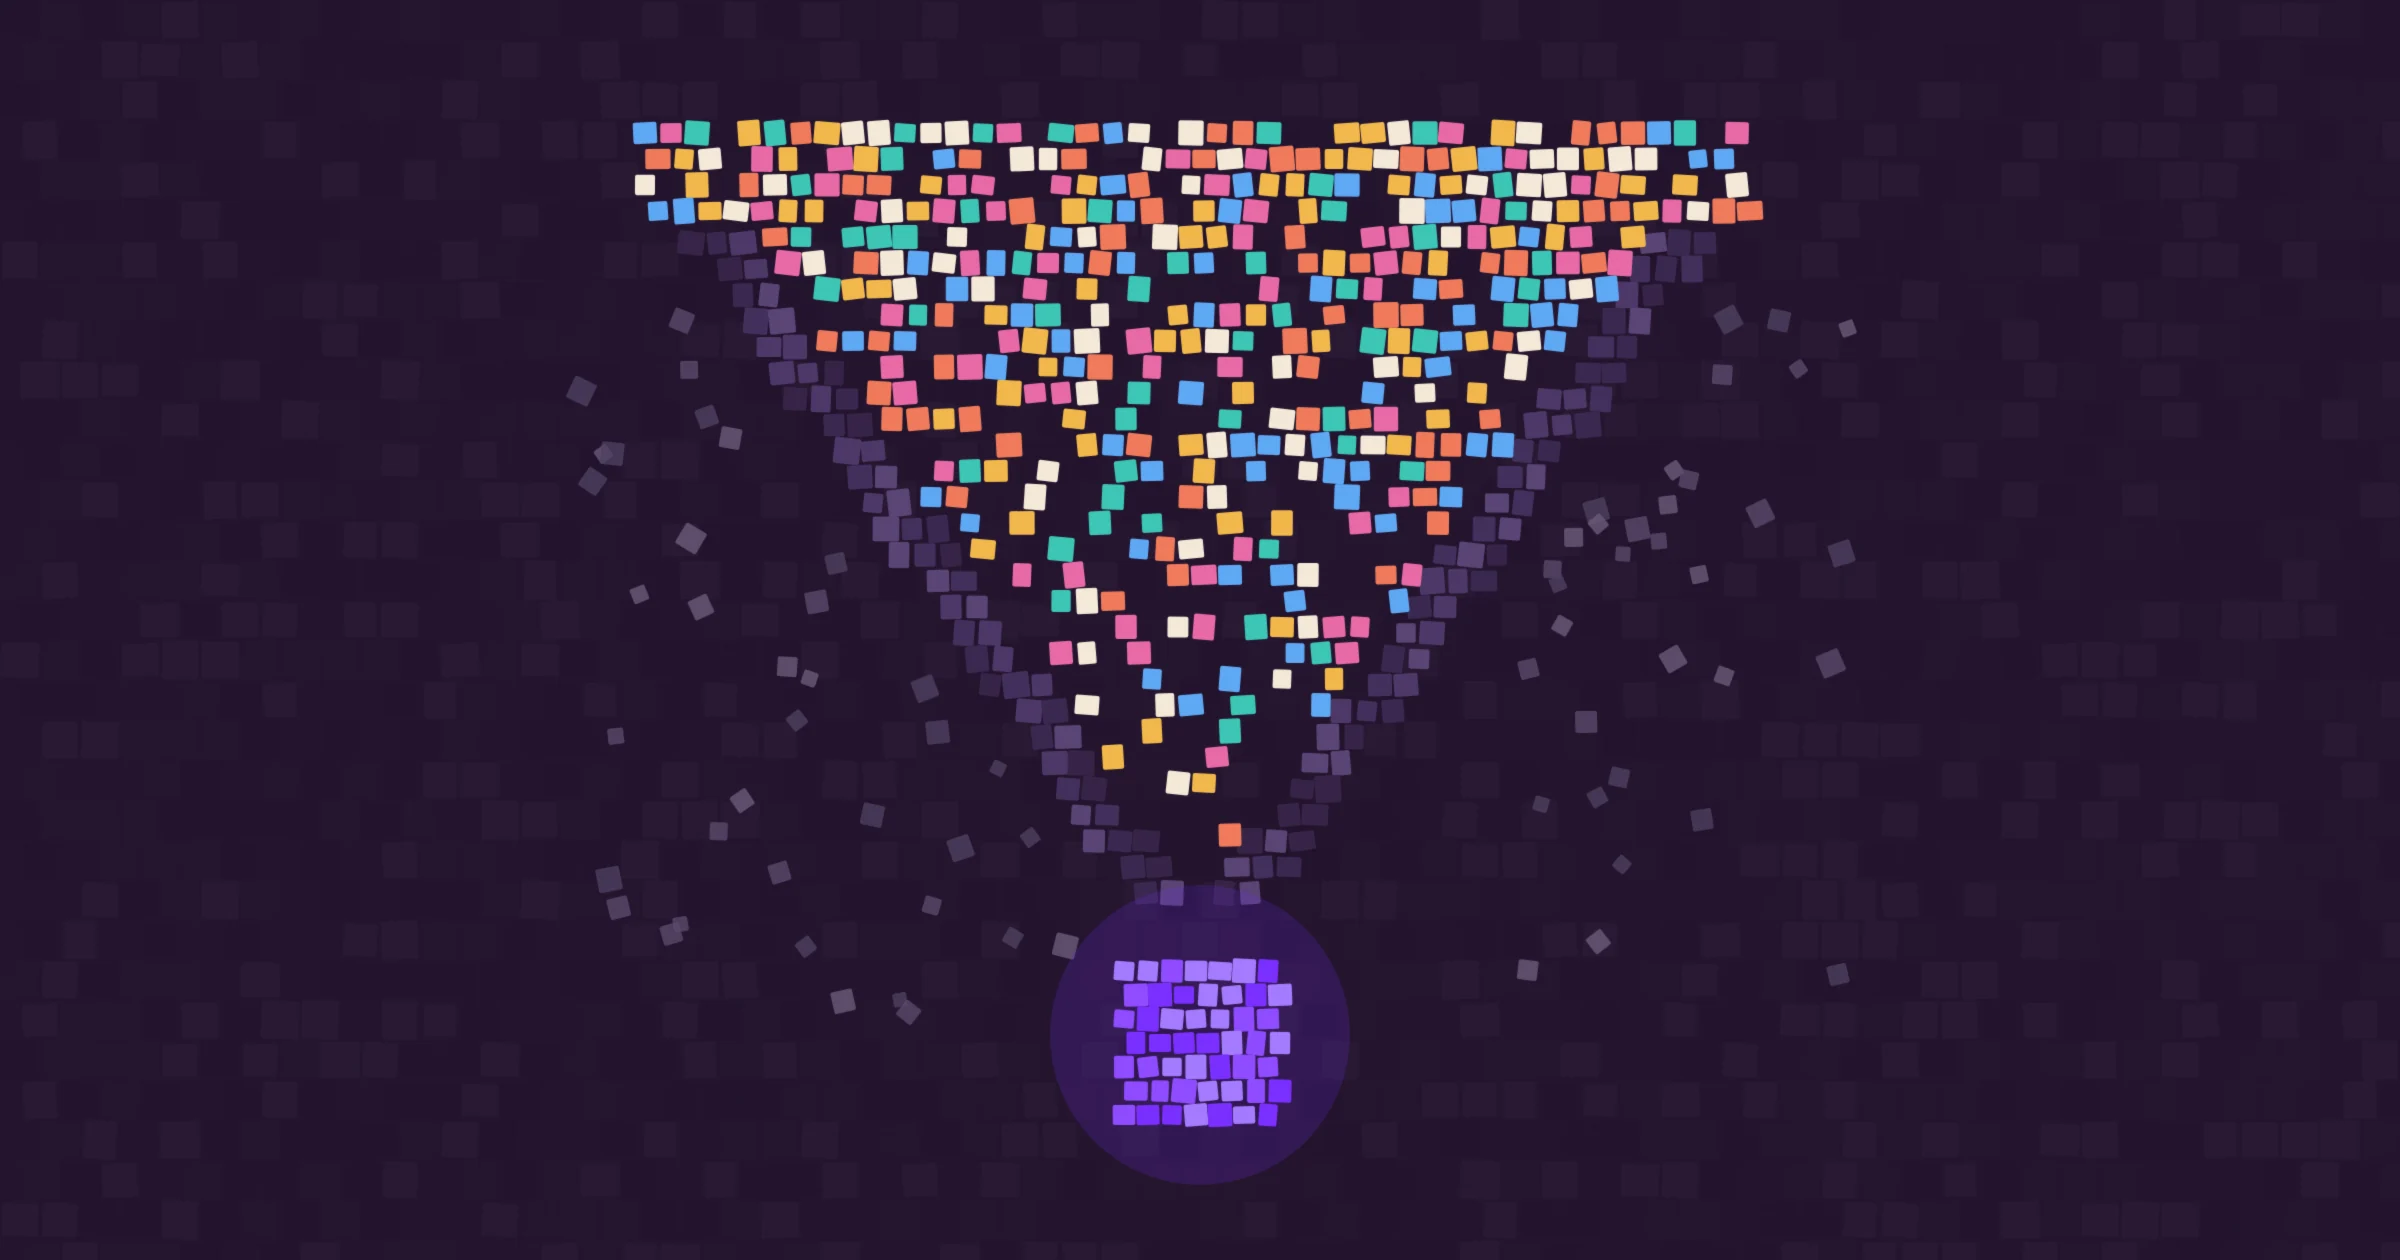
Build a simple funnel for each journey, such as landing page, product page, basket, checkout and order, and look at the share of people who move from each step to the next. Split it by device and channel. The step with the biggest drop on your highest-traffic journey is usually the first place to work. A customer journey map helps you see the steps that happen off the site too.
4. Research why they leave
Numbers show where the problem is, not what it is. Combine several sources:
- Session recordings and heatmaps show where people click, scroll and hesitate. Microsoft Clarity and similar tools offer this free.
- On-page surveys asking one question, such as “What nearly stopped you buying today?” on the confirmation page or “Is anything missing from this page?” on exit.
- Usability tests with five or six people from your audience, each given a real task while they think aloud. A handful of sessions usually reveals the most serious problems.
- Customer service logs, reviews and sales calls, which record the questions people ask before buying in their own words.
5. Write hypotheses
Turn each finding into a statement you can test: “Because recordings show mobile visitors scrolling past the delivery information, showing delivery costs beside the price will increase checkout starts.” A hypothesis names the evidence, the change and the metric, which stops a test from becoming a matter of taste.
6. Prioritise
Score each idea from 1 to 10 for impact, confidence and ease, and start with the highest totals. This is the ICE model. It is rough, but it forces a team to say why an idea deserves time before a designer starts work.
| Idea | Impact | Confidence | Ease | Score |
|---|---|---|---|---|
| Show delivery costs on product pages | 8 | 8 | 9 | 25 |
| Add guest checkout | 9 | 7 | 5 | 21 |
| Rewrite the homepage headline | 6 | 5 | 8 | 19 |
| Redesign the navigation | 7 | 4 | 2 | 13 |
7. Test or implement, then learn
If you have the traffic, run an A/B test. If the problem is obvious, such as a broken form on mobile, fix it without testing. Either way, record the hypothesis, the change, the result and what you learned in one shared log, so the next round of ideas builds on evidence rather than memory.
What to optimise first on each page
Each type of page has its own job, so the usual problems differ. Use this table as a starting checklist, then let your own research decide.
| Page | Its job | Check first |
|---|---|---|
| Homepage | Show who you help and send people on | A headline that says what you do, clear routes to the main products or services, visible trust signals |
| Landing page | Deliver what the ad or search result promised | Message match with the click, one clear call to action, few distractions, proof near the form |
| Product page | Answer every question before the basket | Price and delivery cost, stock, sizing or specifications, good images, reviews, returns policy |
| Service page | Make the next step feel safe | Who it is for, how it works, typical results, a price range or how pricing works, an easy way to ask a question |
| Basket and checkout | Remove effort and surprises | Guest checkout, total cost shown early, few form fields, familiar payment options, clear error messages |
| Lead form | Collect what sales needs and no more | Number of fields, field labels, what happens after submitting, response time promise |
Mobile deserves its own pass. On many sites most visits now come from phones, and those visits often convert at a lower rate than desktop. The cause is usually small tap targets, long forms or content that pushes the call to action below the fold.
A/B testing and when you can’t test
An A/B test splits visitors at random between the current page and a changed version, then compares the results. Because both groups see the site at the same time, the test removes seasonality, campaigns and news from the comparison. That is why companies that test seriously run a lot of experiments: Harvard Business School’s research on experimentation at firms such as Booking.com shows how testing becomes part of everyday decisions rather than a special project.
A well-known UK example comes from GOV.UK. The Behavioural Insights Team, NHS Blood and Transplant and the Government Digital Service tested eight versions of the message shown to people after they renewed their vehicle tax online, each asking them to join the NHS Organ Donor Register. The best wording asked people to reciprocate (“If you needed an organ transplant would you have one? If so please help others”), and GDS estimated it would bring 96,000 more registrations a year than the original call to action.
Tests need volume. To detect a modest improvement with confidence you typically need thousands of visitors and a few hundred conversions per version, run over whole weeks so weekdays and weekends both count. Decide the sample size before you start, and do not stop a test the moment it looks good, because early results swing widely.
If your site has a few hundred conversions a month or fewer, you can still do CRO well:
- Fix clear usability problems found in recordings and user tests without testing them.
- Test bold changes, such as a new offer or a much shorter form, rather than small tweaks that need huge samples.
- Test on a micro-conversion with more volume, such as add to basket, when the final sale is too rare.
- Compare before and after over several weeks, and note anything else that changed in that time, such as prices or campaigns.
CRO and behavioural science
Many of the changes that lift conversions work because of how people make decisions. Reducing choices helps visitors who would otherwise stall. Defaults steer people towards the option most of them want. Showing what others chose reduces uncertainty. Framing an offer in terms of what someone keeps or loses changes how strongly they react to it, which is the idea behind loss aversion.
These effects are useful as a source of hypotheses, not as guaranteed wins. A principle that works in one context can backfire in another, so treat each one as an idea to test. The guide to behavioural science in marketing covers the principles most relevant to websites and where the ethical line sits.
UK rules that limit CRO tactics
Some tactics that raise short-term conversions are now clearly unlawful in the UK. Under the Digital Markets, Competition and Consumers Act 2024, the consumer protection rules that took effect on 6 April 2025 let the Competition and Markets Authority decide cases itself and fine businesses up to 10% of global turnover. Its first investigations, announced in November 2025, targeted online pricing practices at eight businesses, and the CMA sent advisory letters to 100 more.
- Drip pricing: mandatory fees must be included in the price you first show, not added at checkout.
- Fake urgency: countdown timers that reset, sales that never end and false “only 2 left” claims are misleading.
- Fake reviews: buying, writing or selectively hiding reviews is banned outright.
- Pressure and obstruction: making cancellation much harder than sign-up, or pre-ticking paid extras, can count as an aggressive practice.
Testing tools have their own rules. Heatmap, recording and A/B testing tools usually set cookies or similar technology, so check that your cookie banner covers them and that recordings mask anything a visitor types into forms. The UK rules on urgency and loss messages go into more detail on honest scarcity.
How to measure CRO results
Conversion rate on its own can mislead. A discount banner can raise it while cutting profit, and a shorter form can raise leads while lowering their quality. Judge each change on a main metric and a few guardrails:
| Metric | Use it when | Watch out for |
|---|---|---|
| Conversion rate | Comparing versions of the same page | Changes in traffic mix between periods |
| Revenue per visitor | Changes that may affect order size as well as orders | A few very large orders skewing small samples |
| Average order value | Testing bundles, thresholds and upsells | Higher order value with fewer orders |
| Lead to customer rate | Changing lead forms or offers | The delay before leads close |
| Refunds and cancellations | Any change that adds pressure or urgency | Wins that reverse after purchase |
Report CRO in money as well as percentages. “The new checkout added £3,400 a month in revenue at current traffic” is a sentence a business owner can act on, and it makes the case for the next round of work. The same funnel view also helps you measure the marketing funnel as a whole.
Common CRO mistakes
- Copying best practice without research. A change that worked for another business answers their visitors’ questions, not yours.
- Testing small details first. Button colours rarely matter as much as the offer, the price presentation or the length of a form.
- Stopping tests early. A result that looks strong after three days often disappears after three weeks.
- Ignoring mobile. Reviewing pages on a large screen hides the problems most visitors actually meet.
- Optimising one page in isolation. A landing page that converts well on a weak offer just sends more unhappy customers to the next step.
- Treating traffic and conversion as separate jobs. The people who buy ads and the people who run the website need the same numbers, or each will blame the other.
A regular digital marketing audit is a good moment to review conversion alongside traffic, because it puts the cost of each visit and the value of each visit in the same report.
Frequently asked questions
What is conversion rate optimisation?
Conversion rate optimisation (CRO) is the process of increasing the share of website visitors who take a desired action, such as buying or sending an enquiry. It uses analytics, user research and testing to find why people leave and to keep the changes that measurably help.
What is a good conversion rate?
There is no single good rate, because it varies by sector, price, device and how a conversion is defined. Compare your own rate over time and across your pages, channels and devices, where the gaps show you what to fix first.
How do I calculate my conversion rate?
Divide the number of conversions by the number of sessions (or users) and multiply by 100. For example, 160 orders from 8,000 sessions is a 2% conversion rate.
How long does CRO take to show results?
Fixing clear problems, such as a broken mobile form or hidden delivery costs, can show results within weeks. A/B tests usually need at least two full weeks each, and a steady programme builds gains over several months.
Can a small business do CRO without much traffic?
Yes. Fix the problems you can see in recordings and user tests, test bold changes rather than small ones and measure a micro-conversion such as add to basket when sales are too few to test.
Is CRO the same as UX?
They overlap but are not the same. UX design makes a site easy and pleasant to use, while CRO focuses on the actions that matter to the business and measures whether each change increases them.
On this page
Back to topTurn more of your visitors into customers
Kutola helps you find where your website loses customers and why, then prioritises the changes most likely to pay back, from the offer and the copy to checkout and page speed. See how it fits into our brand and digital experience work, or get in touch to talk through your site.