Which marketing KPIs should you track?
Marketing KPIs (key performance indicators) are the few measures that show whether your marketing is moving the business goals it exists to serve, such as revenue, new customers or qualified leads. Each one has a target, a deadline and an owner. Everything else you can count, from impressions to email opens, is a metric that helps explain why a KPI went up or down.
Choosing KPIs is the final step of a digital marketing strategy, and the step where many strategies go vague. This guide explains how KPIs differ from metrics, lists the main marketing KPIs by goal with a formula for each, shows which ones suit different types of business and covers how to choose, measure and report yours so the numbers lead to decisions.
What is a marketing KPI?
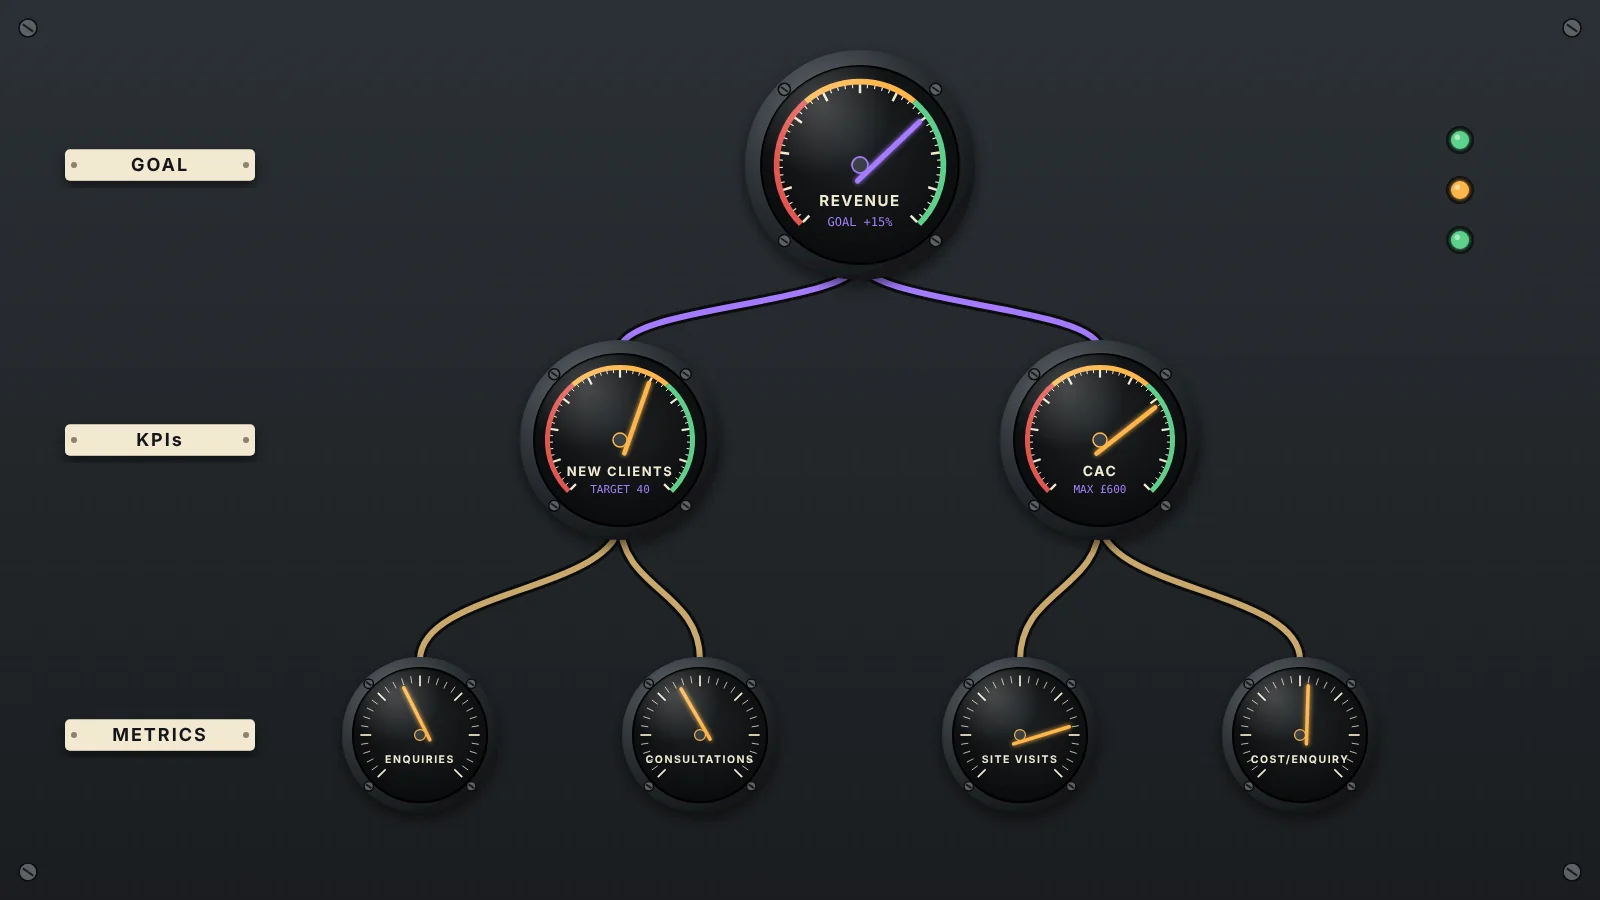
A key performance indicator is a measure tied to an objective. “Win 40 new clients from marketing in 2027 at no more than £600 each” gives you two KPIs: new clients and customer acquisition cost. Both have a number and a date, so by May the team can see whether the year is on track.
Good marketing KPIs have four things in common:
- They connect to a business goal. If a KPI could double while sales and profit stay flat, it is the wrong KPI.
- Marketing can influence them. Marketing can raise enquiries. It cannot, on its own, fix a product that half of customers send back.
- They are measured the same way every time. A written definition (what counts as a qualified lead, which data source, which date range) saves an argument at every review.
- There are only a few of them. Three to five KPIs for the whole marketing function is enough for most small and mid-sized businesses. A report with twenty “key” indicators has none.
KPIs vs metrics
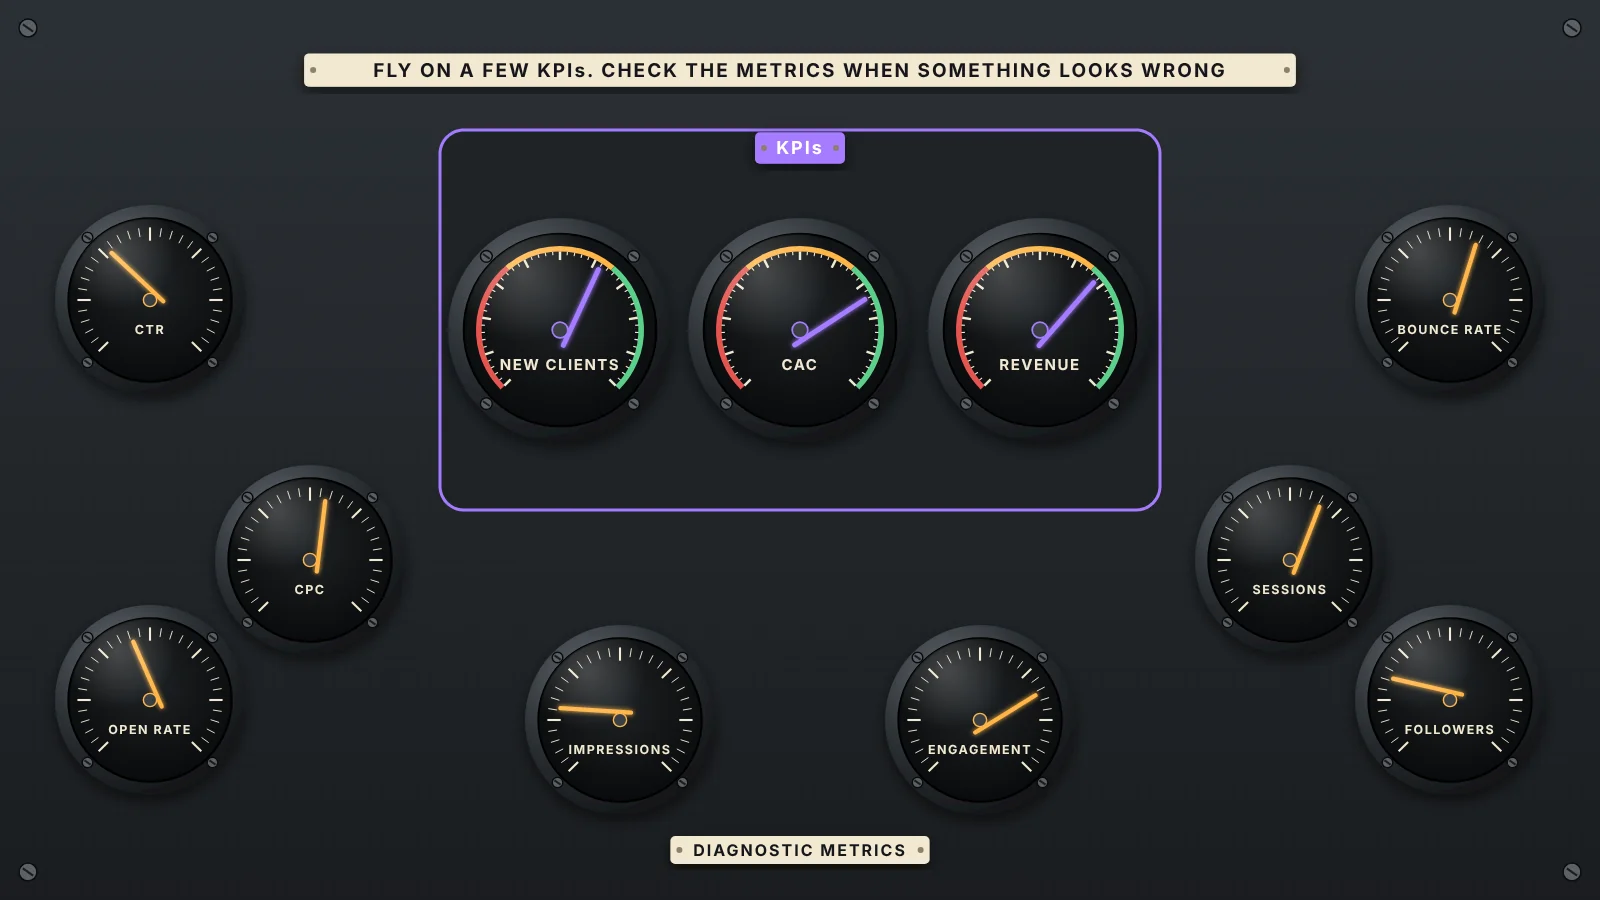
Every KPI is a metric, but most metrics are not KPIs. Click-through rate, cost per click, open rate, bounce rate and follower growth are diagnostic metrics. A KPI tells you whether marketing is working. Metrics tell you where to look when it is not: if new clients fall short, the metrics show whether the problem is too few visitors, a weak landing page or slow follow-up.
It also helps to know which of your numbers are lagging and which are leading. Revenue and new customers are lagging indicators: they report what has already happened. Qualified enquiries, demo bookings or add-to-basket rate move weeks earlier, so pairing each KPI with a leading indicator gives you time to react within the quarter.
Numbers that look impressive but do not change any decision, such as total followers or page views on their own, are often called vanity metrics. A sudden drop in one can still flag a problem, so keep them in the channel reports and off the KPI line.
Marketing KPIs by goal
The table groups the most widely used marketing KPIs by the business goal they serve. Choose from the rows that match your objectives, not from every row.
| Goal | KPI | How to calculate it |
|---|---|---|
| Profitable growth | Marketing ROI | (Gross profit from marketing-sourced sales minus marketing cost) ÷ marketing cost |
| Profitable growth | Revenue from marketing | Sales from customers whose first contact came through a marketing channel, from your CRM or analytics |
| New customers | Customer acquisition cost (CAC) | Total sales and marketing cost ÷ new customers won in the same period |
| New customers | Customer lifetime value (CLV) | Average order value × orders per year × years a customer stays × gross margin |
| Leads and pipeline | Qualified leads | Leads that meet the definition agreed with sales, counted by source |
| Leads and pipeline | Lead-to-customer rate | New customers ÷ qualified leads from the same period |
| Online sales | Conversion rate | Orders ÷ sessions |
| Online sales | Return on ad spend (ROAS) | Revenue from ads ÷ ad spend |
| Retention | Repeat purchase rate | Customers who bought more than once ÷ all customers in the period |
| Retention | Churn rate | Customers lost in the period ÷ customers at the start of it |
| Brand | Share of search | Searches for your brand ÷ searches for all brands in your category |
ROAS and ROI are easy to confuse. ROAS divides revenue by ad spend, so a campaign with a ROAS of 4 can still lose money once product costs, delivery and staff time are counted. Use ROAS to compare campaigns with each other and ROI or profit to decide whether marketing pays for itself. Paid channels bring extra measurement problems, such as two platforms claiming the same sale, which are covered in how to measure paid media.
CLV and CAC are most useful side by side. If a customer brings in £900 of gross profit over their lifetime and costs £300 to win, you can afford to spend more to win the next one. If the two numbers are close, growth is costing you money.
Marketing KPIs by business type
The right set depends on how your customers buy. These starting points cover the most common models:
| Business | Main KPIs | Leading indicators |
|---|---|---|
| Online shop | Revenue, conversion rate, average order value, repeat purchase rate | Add-to-basket rate, email list growth |
| B2B services | Qualified leads, pipeline value from marketing, win rate, CAC | Consultation or demo bookings, branded search |
| Local business | Bookings or calls, review rating, revenue per customer | Calls, direction requests and website clicks from your Google Business Profile |
| Subscription or software | Monthly recurring revenue, churn rate, CLV against CAC | Trial sign-ups, share of trials that activate |
B2B marketing KPIs need extra care because of the sales cycle. If a deal takes six months to close, a quarter’s lead numbers say little about that quarter’s revenue. Track the pipeline value marketing creates alongside closed revenue, and agree with the sales team what a qualified lead is before the year starts, or each side will count something different.
How to choose your marketing KPIs
Work from the business goal down, not from the reports your tools already produce:
- Start with the business goal. Write it in money or customers, for example “grow revenue from new clients by 15% in 2027”.
- Work out marketing’s share. Decide how many new customers the goal needs and how many should come from marketing rather than referrals or direct sales. Then work back through your funnel conversion rates to the leads or visits required.
- Pick one KPI per objective, plus a cost KPI. A volume target with no cost limit invites growth at any price.
- Add a leading indicator to each KPI. It is your early warning while there is still time to change course.
- Set a baseline and a target. Use the last twelve months as the baseline. If the data is unreliable, check your tracking first: a digital marketing audit shows quickly whether the numbers can be trusted.
- Write each definition down. One line per KPI: formula, data source, owner and review date. The measurement section of your marketing plan is the natural place for it.
Brand KPIs and share of search
Brand building pays back over months and years, so it rarely shows up in a monthly lead report. That makes it the easiest budget to cut, and the cost appears later as leads that get steadily more expensive. A brand KPI keeps that work visible.
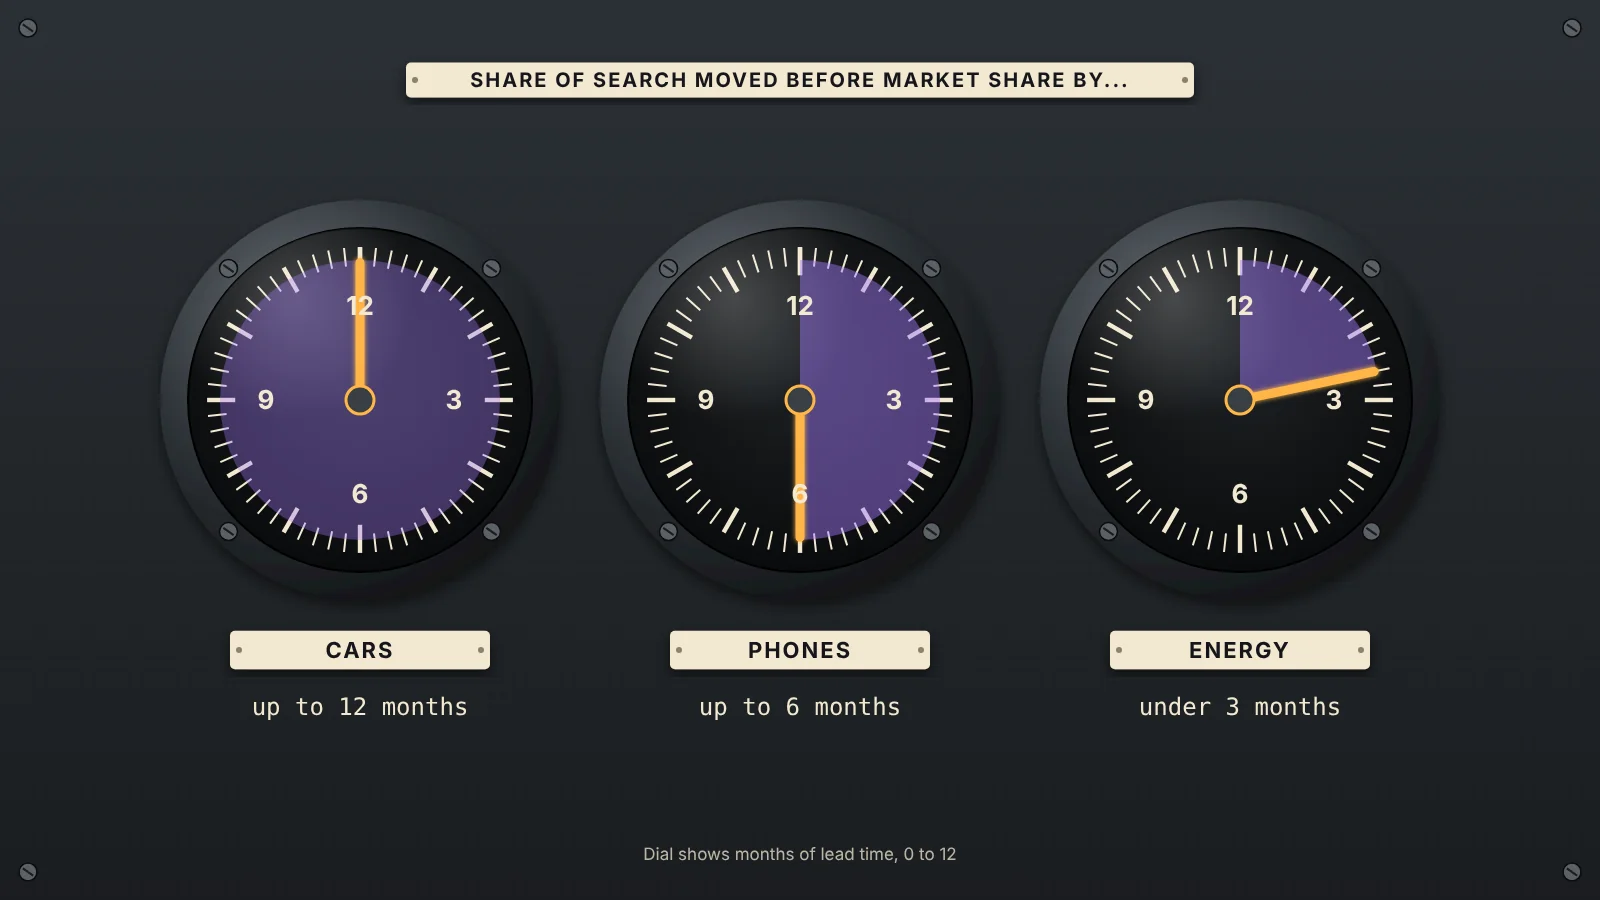
Share of search is the most practical one for smaller businesses, because the data is free. At the IPA’s EffWorks Global conference in 2020, Les Binet, then head of effectiveness at adam&eveDDB, showed that a brand’s share of category searches tracked its market share and often moved first: up to twelve months ahead for cars, up to six months for mobile phones and less than three for energy. A follow-up IPA think tank tested the idea on 30 case studies across 12 categories and seven countries and found a strong link, while stressing that it is a correlation, not proof of cause.
To measure it, enter your brand name and those of up to four competitors in Google Trends for the UK, then divide your volume by the total. Smooth the result with a rolling average over several months, because weekly figures jump around. Two other brand measures sit well beside it:
- Visibility in AI answers. How often ChatGPT, Gemini or Google’s AI features mention you compared with competitors when asked your customers’ questions. Prompt tracking and AI referral traffic are explained in how to measure GEO performance.
- Discovery on social platforms. The share of your views that come from search shows whether people look for your content or only scroll past it. Measuring social media SEO shows where to find that figure on each platform.
How to report marketing KPIs
A KPI report exists to prompt decisions, so keep it to one page and give every line a target, a result and a next step. This illustrative first-quarter scorecard is for a regional accountancy firm:
| KPI | Q1 target | Actual | Status | Next action |
|---|---|---|---|---|
| New clients from marketing | 12 | 9 | Behind | Consultation-to-client rate fell from 30% to 22%, so review how proposals are followed up |
| Customer acquisition cost | £600 | £540 | On track | No change |
| Qualified enquiries | 45 | 41 | Slightly behind | Move budget from display to the search campaign with the lower cost per enquiry |
| Share of search against two local rivals | 30% | 33% | Ahead | Keep the spring radio and local press activity |
Check leading indicators and channel metrics monthly, compare KPIs with their targets every quarter and question the KPI set itself once a year. In Google Analytics 4, mark the actions that feed your KPIs, such as form submissions, purchases or booking clicks, as key events, so they appear in the acquisition and landing page reports by channel. Stages that happen offline, such as signed contracts, need data from your CRM.
Watch for KPIs that start steering behaviour the wrong way. A cost-per-lead target pushes a team towards cheap leads that never buy, and a target on lead volume alone fills the CRM with names sales will not call. Pairing volume with quality, and cost with outcome, keeps the numbers honest.
Frequently asked questions
What are marketing KPIs?
Marketing KPIs are the few measures that show whether marketing is achieving its business objectives, such as revenue from marketing, new customers, customer acquisition cost or qualified leads. Each one has a target, a deadline and an owner.
What is the difference between a KPI and a metric?
A KPI is a metric tied directly to an objective and reviewed against a target. Other metrics, such as click-through rate or open rate, are diagnostic: they explain why a KPI moved and show where to fix it.
How many marketing KPIs should you track?
Most small and mid-sized businesses need three to five KPIs for the whole marketing function, each with one leading indicator. Channel teams can track more metrics, but they should not all be reported as KPIs.
What are the most important digital marketing KPIs?
It depends on the business model, but the KPIs that matter most usually measure outcomes and cost together: revenue or new customers from marketing, customer acquisition cost, conversion rate and customer lifetime value. Add a brand measure such as share of search so long-term work stays visible.
What are good KPIs for B2B marketing?
B2B teams usually track qualified leads, pipeline value created by marketing, win rate and customer acquisition cost. Because sales cycles are long, they also need a leading indicator such as consultation bookings and an agreed definition of a qualified lead.
How often should you review marketing KPIs?
Check leading indicators and channel metrics monthly, review KPIs against target every quarter and revisit which KPIs you use once a year or when the business goals change.
On this page
Back to topKnow which numbers your marketing should move
Kutola helps businesses choose marketing KPIs that trace back to real goals, fix the tracking behind them and build a one-page report the team will use. Get in touch to set up your scorecard.